CLion
CLion being an IDE, offers a simpler and more intuitive way of building, flashing and debugging applications. Building and flashing can be done in a single click, without having to activate the virtual every time you wish to use west and debugging is much simpler, as breakpoints can be set using the GUI and the values of variables can also be viewed through the GUI. Actions like step are also much easier to execute through the GUI. The only downside to using CLion is that it is heavier than a few popular IDEs and editors.
To use CLion for building, flashing and debugging, a CMake profile and Run/Debug using OpenOCD must be configured correctly. This guide, based on the one published by Zephyr, but modified for our board (stm32f4_disco), walks you through the setup procedure.
Required plug-ins
Make sure you have installed the CMake plugin for CLion before moving to the configuration.
Getting started
Clone your assignment repository and open it as a CLion project, to get started with the setup.
Note, this is a project specific set-up, so for each new project (Assignment B, or a new checkout of your repo), you will have to repeat these steps.
For the CMake configuration, Windows users should follow CLion CMake setup for Windows users and Linux (all distributions) should follow the CLion CMake setup for Linux users.
CMake Profile - Windows
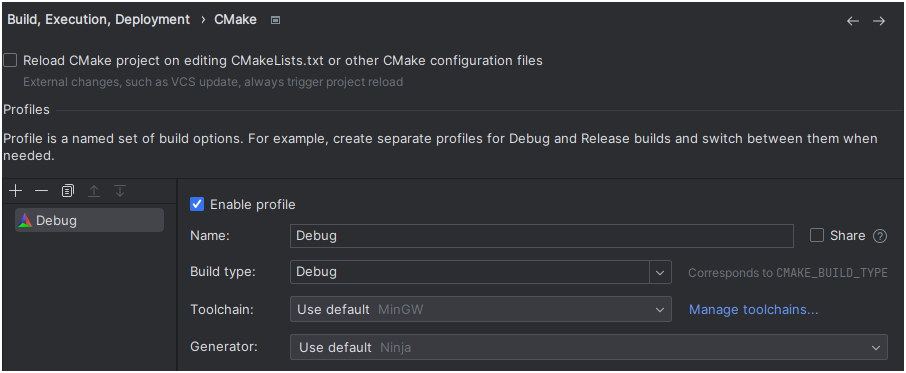
The first step is to create a CMake profile. If you are opening a repo for the first time, then CLion may open this window for you. If it doesn't open automatically, open the CLion settings wizard and navigate to the CMake submenu, under the Build, Execution and Deployment menu. Then clock on Add profile. Then click on Manage toolchains
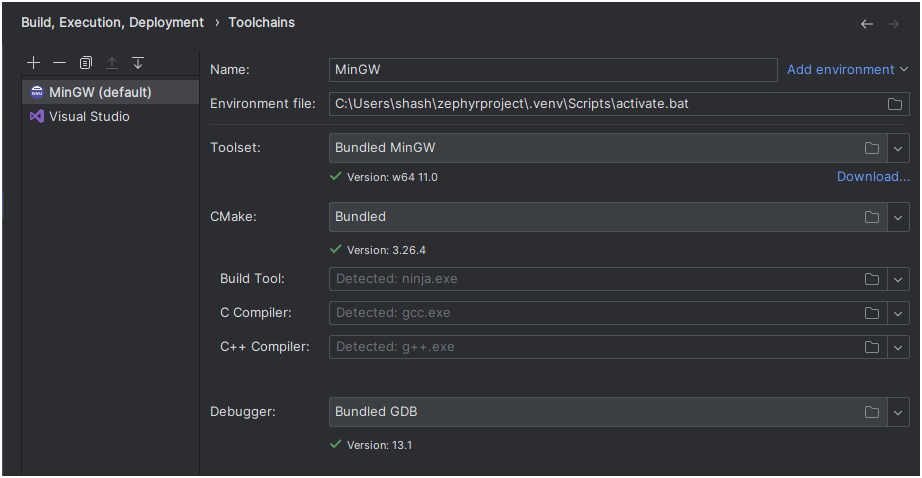
Then click on Add environment and enter the path to your zephyrproject folder, followed by \.venv\Scripts\activate.bat. Ensure you use the bundled CMake and MinGW tool-set. Then click on apply.
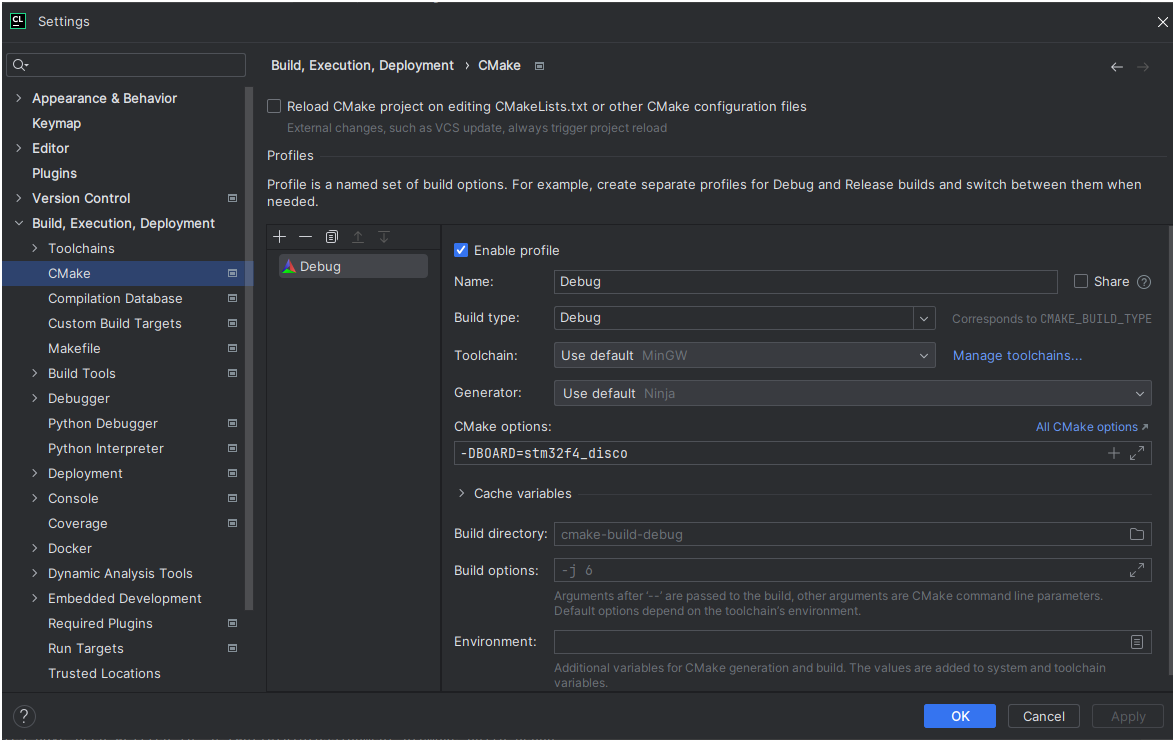
You should now be redirected to the CMake Profile window in Figure 1. Add the following option to CMake options: -DBOARD=stm32f4_disco. Then click on apply and close the window. If the configuration was done correctly, you can see that the CMake execution finishes successfully (in the CMake terminal in CLion) and a cmake-build-debug folder is created.
New CMake Profile - Linux
The first step is to create a CMake profile. If you are opening a repo for the first time, then CLion may open this window for you. If it doesn't open automatically, open the CLion settings wizard and navigate to the CMake submenu, under the Build, Execution and Deployment menu. Under this menu, click on Add Profile. Then, add the following CMake option - -DPython3_EXECUTABLE:FILEPATH=~/zephyrproject/.venv/bin/python3.
The final configuration should resemble the screenshot below:
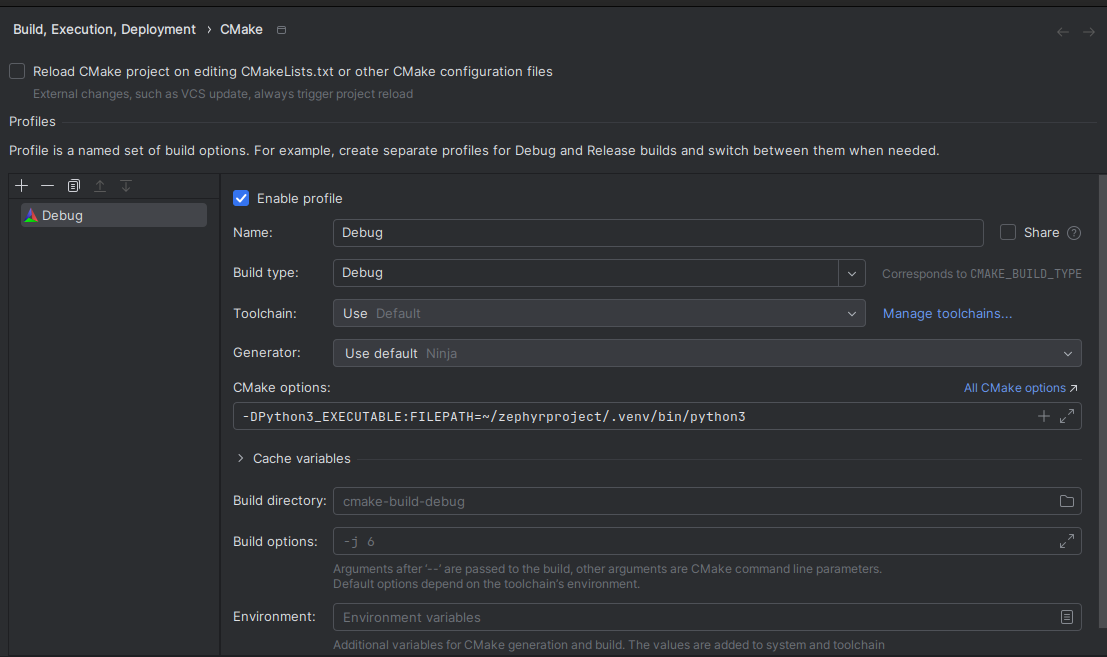
This concludes the CMake profile setup, if all the steps were followed correctly, a CMake build should have been triggered (can be seen in the CMake window). Furthermore, if the CMake build was successful, a new cmake-build-debug directory must have been created in the project directory.
Note: The next section is common for both Windows and Linux users
Run/Debug configurations
The next and final step is to correctly set up the Run/Debug configurations so the board can be flashed and the onboard debugger can be used for debugging through CLion.
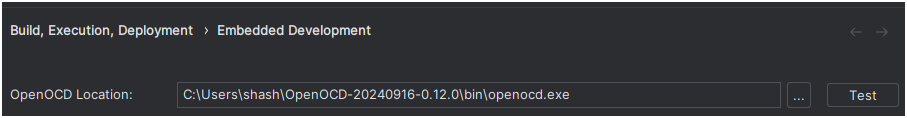
First, make sure that your OpenOCD location is set correctly. This can be found under Settings -> Build, Execution and Deployment > Embedded Development.
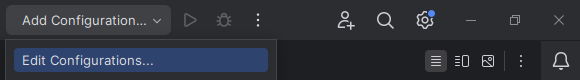
In order to do so, the Edit Configurations wizard under Add Configuration... needs to be used. This can be found in the CLion title bar. (Refer to the screenshot below)
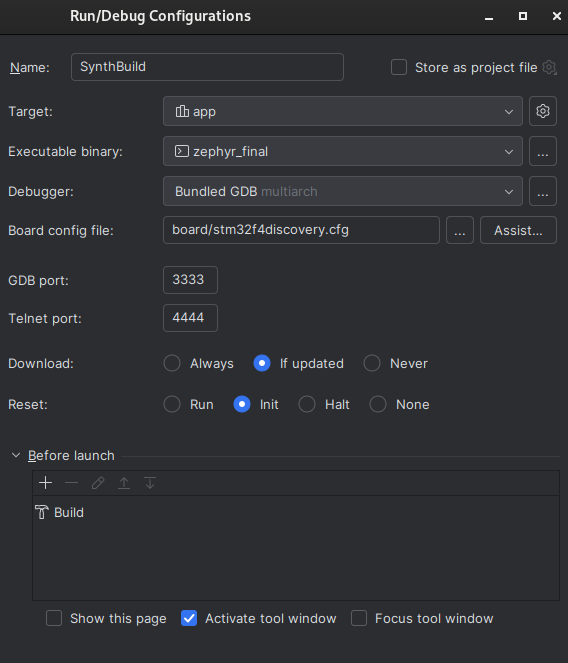
Once the wizard launches, use the + icon to add a new OpenOCD Download & Run configuration. Set the Target to app and Board to board/stm32f4discovery.cfg.
The configuration should look like this:
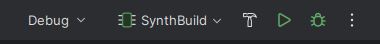
If all the steps have been followed correctly, then the run and debug icons (right hand side of the title bar) should now be green, like in the image below:
Note the Run/Debug configuration name may differ, as this is user defined
Building, flashing and debugging can now be done using these icons. Clicking on any of them should show that the building and flashing/debugging steps are being executed in the terminal.