Functional Verification
All the vhdl code (except the benchmarks files) is located in the rtl folder.
The sim folder contains all files required for simulation,
and the fpga folder contains all files needed for FPGA implementation.
To verify the correctness of your HDL dsign, you should run both module level and system level simulation. To perform module level verification, you have to write a testbench yourself. That test bench can then test a single module of your design.
System level verification
For system level verification, we have already provided you with a top-level testbench.
You can find it in sim/testbench_vivado_1.vhd. To run it, follow these steps:
- Open the vivado project, in vivado, not vitis. You can find it in
sim/_zynq_sim/synq_sim.xpr. - Find the Flow Navigator pane, it's left of the main window.
- Select
IP INTEGRATOR → Open Block Design. This will open the block diagram of your HDL design, showing you the address map of its components.- If you double click on a component here, you can change its parameters. However, be careful if you do that, because if you change a parameter that corresponds to a value in VHDL, you must also change that value in VHDL, otherwise it will not actually be updated.
- Select a program to test with. By default this is
benchmarks/opcodes/opcodes.asm. However, you can change which one it uses inrtl/platform/bram.vhd. For example, you can set it to runpi, which is the name of another benchmark.- The benchmarks are programs written in c, which can be compiled for our simulated MIPS processor, generating a vhd file with the mips instructions in RAM. Check
benchmarks/README.mdfor further instructions andsim/main_pack_opcodes.vhdfor an example vhd. - The simulator outputs over UART, which by default is saved in
sim/zynq_sim/zynq_sim.sim/sim_1/behav/xsim/uart_output.txt. However, if you'd like to change this you can do so by changing the Log File parameter of the uart component.
- The benchmarks are programs written in c, which can be compiled for our simulated MIPS processor, generating a vhd file with the mips instructions in RAM. Check
- Start the simulation
- Go back to the Flow Navigator pane
- Select
SIMULATION → Run Simulation → Run Behavioural Simulation.
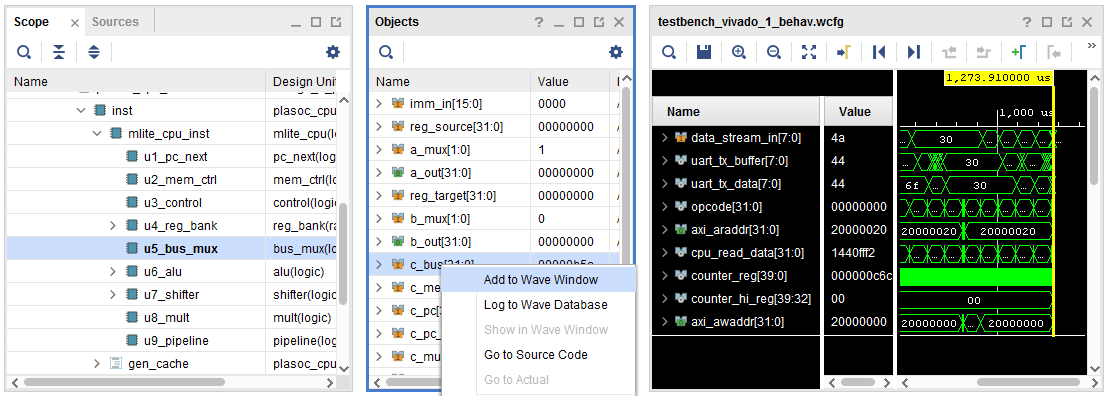
At this point, you can select which signals you'd like to inspect in the waveform output of your design. In the image below, you can see how to do this.
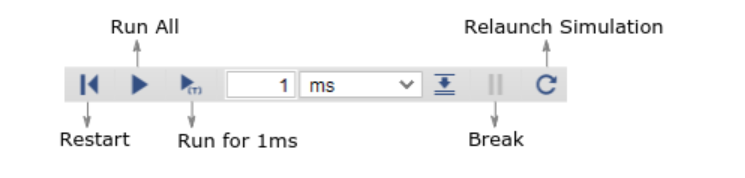
Now, you can either run the simulation until manually interrupted (the Run All button) or by setting the simulation time in the textbox and pressing the smaller arrow besides it. To get an idea of the timescales we're working with, the main_pack_opcodes benchmark takes around 35ms.
NOTE: Every time you make a change in the RTL code, the simulation should be relaunched.
For more information, this manual, and this tutorial might help you.
Once your design passes system level verification, you can continue to the next step: Synthesizing your design. However, if the tests don't pass, you will need to revisit your HDL code and redo the steps in this chapter.
Custom Tests
The assembly code corresponding to a test of all possible ISA opcodes is provided in benchmarks/opcodes/opcodes.asm.
Although it can help you debug your design, you might want to make some finer grained tests than that.
For that reason, we also include a cross-compiler and assembler for the MIPS architecture you're working on.
To make your own benchmark written in C, you can change the c code in benchmarks/custom.
To run these, execute
cd benchmarks/custom
make clean image
A corresponding .vhd file will be generated in the same folder.