Lecture 6
Class Diagram
What are classes and objects (in OOP)?
A class is blueprint for an object. It describes what an object will be, but it is not the object itself. An object is particular instantiation of a class.
Rust is not an object oriented programming language, but it does support the paradigm. See the relevant chapter in the Rust Programming Language Book.
A class diagram describes the structure of classes in the system and the various kinds of static relationships among them.
It visualizes:
- static properties and operations of classes
- attributes, methods, associations
It does not show:
- how the classes interact dynamically
- implementation details
When to use:
- Describe the structure of the system
- During conceptual modeling
- Translating models into code
Class notation:
- Class is inside a rectangle
- Name is in a box at the top
- Fields (also known as attributes or properties) in the middle
- Methods at the bottom
Class relationships
We covered several relationships that can be shown on a class diagram.
Simple association
- Solid line without arrowhead
- Mainly used to show cardinality between classes
Generalization
- Represents "is-a" relationship
- Solid line with hollow arrowhead
- Used for inheritance
- Points from child to parent

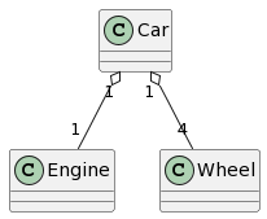
Aggregation
- Represents "is part of" relationship
- A solid line with an unfilled diamond
- The child object can exist even without parent

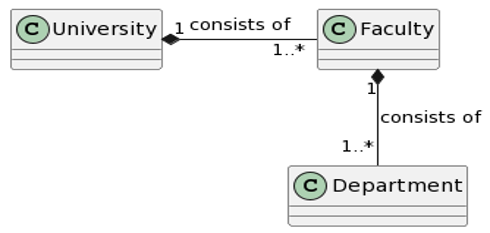
Composition
- Represents "is entirely made of" relationship
- A solid line with a filled diamond
- Objects have the same lifetime

In Rust, aggregation and composition have a nice interpretation.
A composition can be thought of as a field on the parent. Any instance of A will have ownership of an instance of B. Once A is dropped, B will also be dropped.
#![allow(unused)]
fn main() {
struct A {
    b: B
}
}
An aggregation can be thought of as a field with a reference to the child. It could be a
&T,Rc<T>, orArc<T>. What is important is that the child can exist even without the parent. The child can outlive the parent.#![allow(unused)] fn main() { struct A { b: Arc<B> } }
Component Diagram
Component diagram divides a complex system into multiple components and shows the inter-relationships between the components.
Components represent a module of classes that are an independent system with the ability to interface with other rest of the complex system.
It is useful for:
- Show the organization of the system (physical and software structure)
- Show the system's static components and their relations
Component Notation:
- A component is a rectangle with the stereotype
<<component>>and/or an icon. - Components can be grouped into packages which are also represented with named rectangles.
Types
We covered two ways to make component diagrams:
Dependency:
- Indicates that the functionality of one element depends on the the existence of another component
- Dotted arrows are used between components with labels
- Higher level form of component diagram
- Think about
usestatements or the dependency list inCargo.toml

Assembly:
- Tells you exactly what information is being used by each component
- Connections between components go through interfaces
- Provided interface: Circle on the end of a solid line (sometimes called a lollipop) that represents something the component provides, generates, or gives
- Required interface: Open arc at the end of a solid line (sometimes called a socket) that shows that a component depends on some provided interface
- Every interface has one exactly one component that provides it
- Multiple components can depend on the same interface
- You can have multiple interfaces between two diagrams if they are passing information back and forth or if multiple different interfaces exist between the components (even one-way)

Deployment Diagram
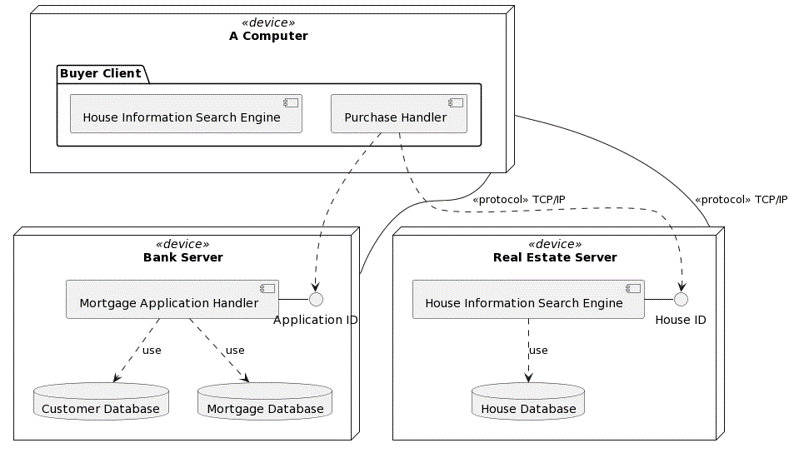
A deployment diagram shows how a system may be deployed in the real world. It is a type of structural diagram that shows a system’s physical layout, revealing which pieces of software run on what pieces of hardware.
- It shows the physical deployment of the software elements
- It illustrates runtime processing for hardware
- It provides the topology of the hardware system

The diagram is made up of nodes (the boxes) and connections (solid lines between nodes).
<<software>> and <<hardware>> stereotypes are used to distinguish between types of nodes.
It is possible to combine component and deployment diagrams.

Note that the example above uses dotted arrows in place of sockets for the required interfaces. In your assignments, please use the socket notation (
--(in PlantUML).
Sequence Diagram
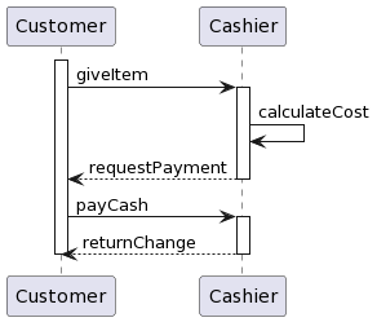
A sequence diagram models a single scenario in the system. The diagram shows how example objects interact with each other and the messages that are passed between them.

What do you see in this diagram?
- Sequence of interactions or actions
- Action of buying remains active while the Cashier is active.
- Do dotted lines mean that the messages are optional? No, they are used for simple return messages.
A sequence diagram shows:
- Lifetimes of participants
- What messages are sent between participants
- How objects are activated
- Which object is controlling the flow
Notation
Participants
- Rectangle or another icon
- Can be named or anonymous, with syntax
ObjectName:ClassName - Lifetime of the participant is shown with a vertical line
Messages
- Arrows going from one participant to another
- They have labels to describe the content of the message
- Different arrow types have different meanings (mainly synchronous vs. asynchronous) (see the tutorial for more information)
Activations
- Thin rectangle on top of lifetime
- Signifies that the participant is performing an operation or action
Opt Fragment
- Used to mean that the fragment only executes only if some condition is true
- Condition in square brackets:
[condition]
Loop Fragment
- Signifies some fragment executes multiple times while the condition is true or for each item
- Condition or collection in square brackets:
[while cond]or[for each item in collection]
Alt Fragment
- Shows possible alternative executions depending on situation
- Similar to
if / else if / elseormatchexpressions - Each case is separated by a dotted line, with situation described in square brackets:
[condition]
Other fragment types exist, such as
breakfor breaking out of another fragment,parfor parallel execution, orcriticalfor critical sections.